
Microsoft Intune and custom reporting
The reporting options in Microsoft Intune isn’t the best as of now. It’ll gradually get better, but there’s always different opinions about how to do reporting. Where they should be located? How they should be displayed? Which filtering/grouping options should it have? To fix that and get all the reports YOU want and display them exactly as YOU want, you can use Microsoft Power BI.
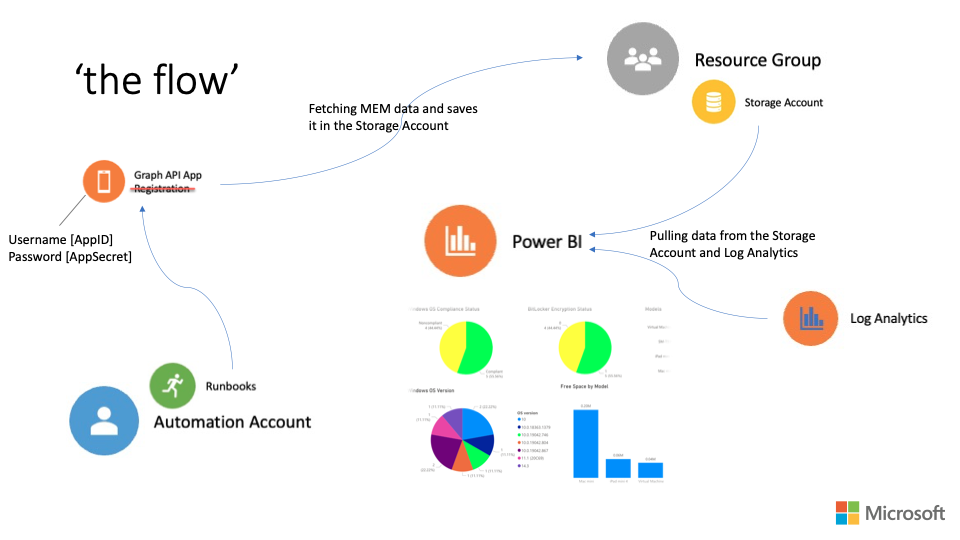
This solution is built on top of the awesome work that some of my colleagues in Microsoft created/presented earlier this year (Karli Stites, Pratik Mehta, Ray Pearson). The presentation was internal, but the solution is available on GitHub with a step-by-step guide (see Link section). I’ve just added on to it with additional information from MEM via Microsoft Graph API and Log Analytics. The basic building blocks and flow look like this:
When creating the storage account and the different containers you can under “lifecycle management” specify the retention period. Meaning you can specify how many days of historical data you want. The longer it is, the more data will be stored and that will of course affect how much you’ll have to pay.
Then, do the “app registration” from the Azure portal. This will function as your service account and the app secret will be the password. When creating the app secret, be aware it’s only visible when you create it. You cannot go back and view it. So, save it in a secure location.
The “automation account” configuration will contain “variables”, “credentials” (app id + secret), “schedules” (how often to run your runbooks), and finally your “runbooks”. These can be created using several types of script, but in this example it’s PowerShell.
The runbooks gather information from Intune via Graph and saves them as .CSV files in the different blob containers. Now you can pull those from Power BI and go crazy with creating reports!
Custom report examples
In my lab, I now have twelve different reports. Those are “overall operational compliance view”, “servicing overview”, “AV report”, “malware”, “servicing comparison”, “servicing details”, “patch status”, “apps”, “delivery optimization”, “naming standard”, and “device info”.
Publicly published reports from Power BI
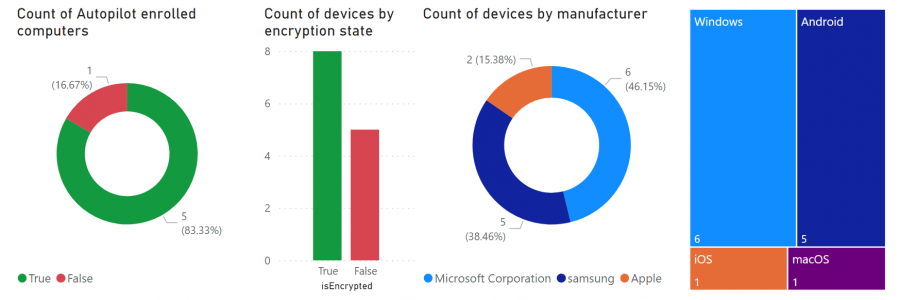
Live view from my Power BI reports:
Add content from Log Analytics
I’ve added Log Analytics as a source to my reports as well. Hadn’t thought of doing that before starting to play around with the solution. Turned out to be super easy to do. Here’s how:
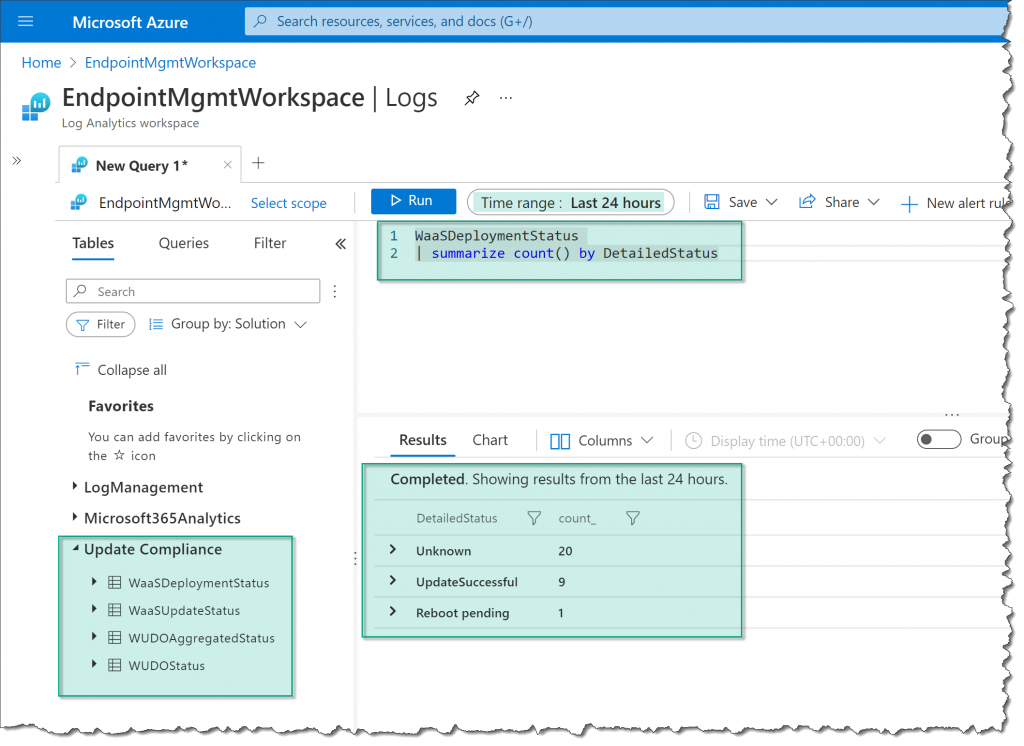
Go to Log Analytics and write your Kusto query.
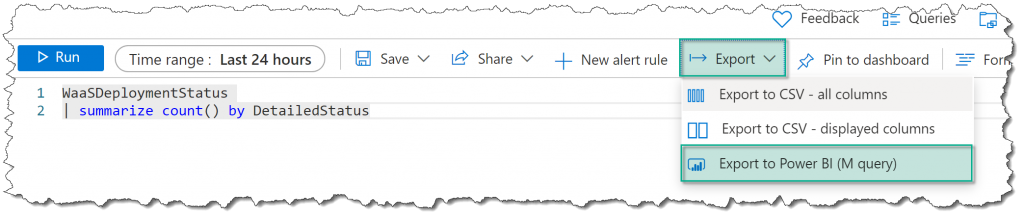
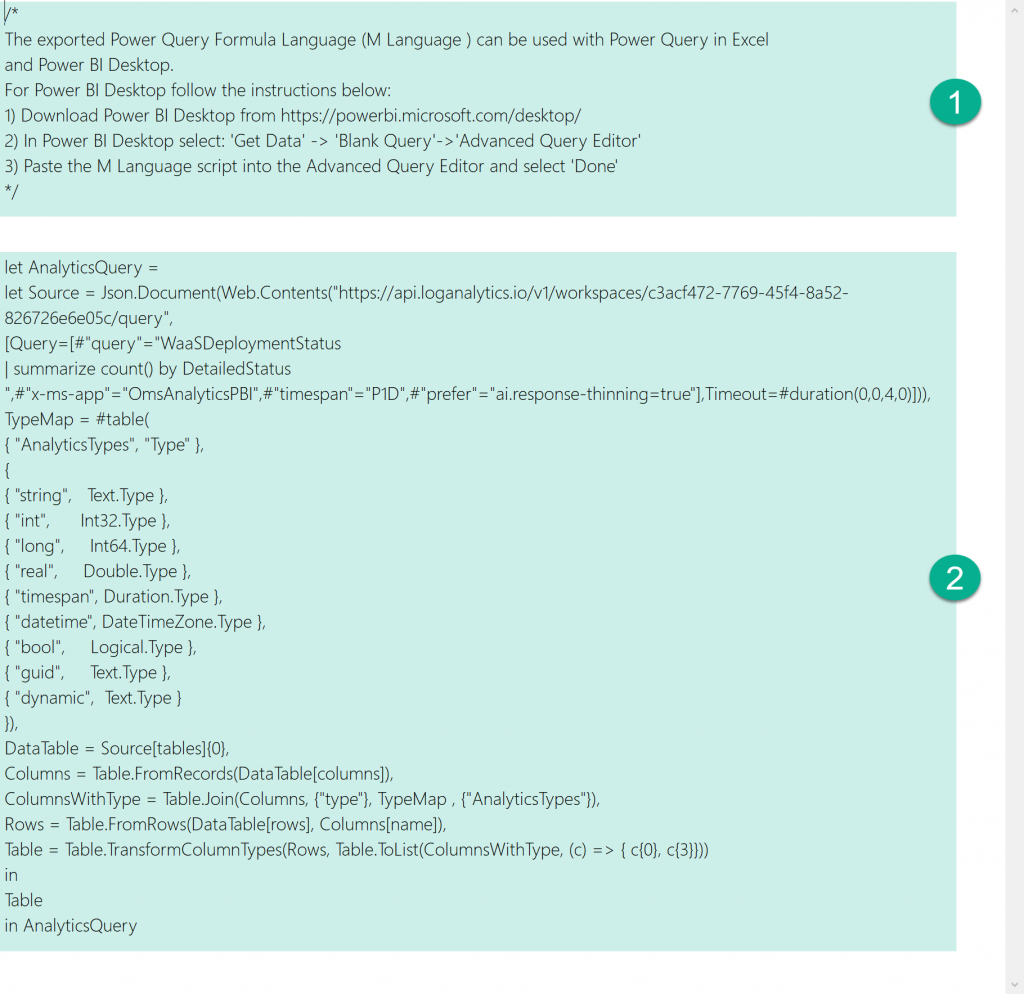
Then click on “|-> Export” and select “Export to Power BI (M query)”. That’ll start to download a .txt file to your computer.
The content contains of two sections. First, the steps you need to do in Power BI to add it as a source. The second, is the actual query you’ll use.
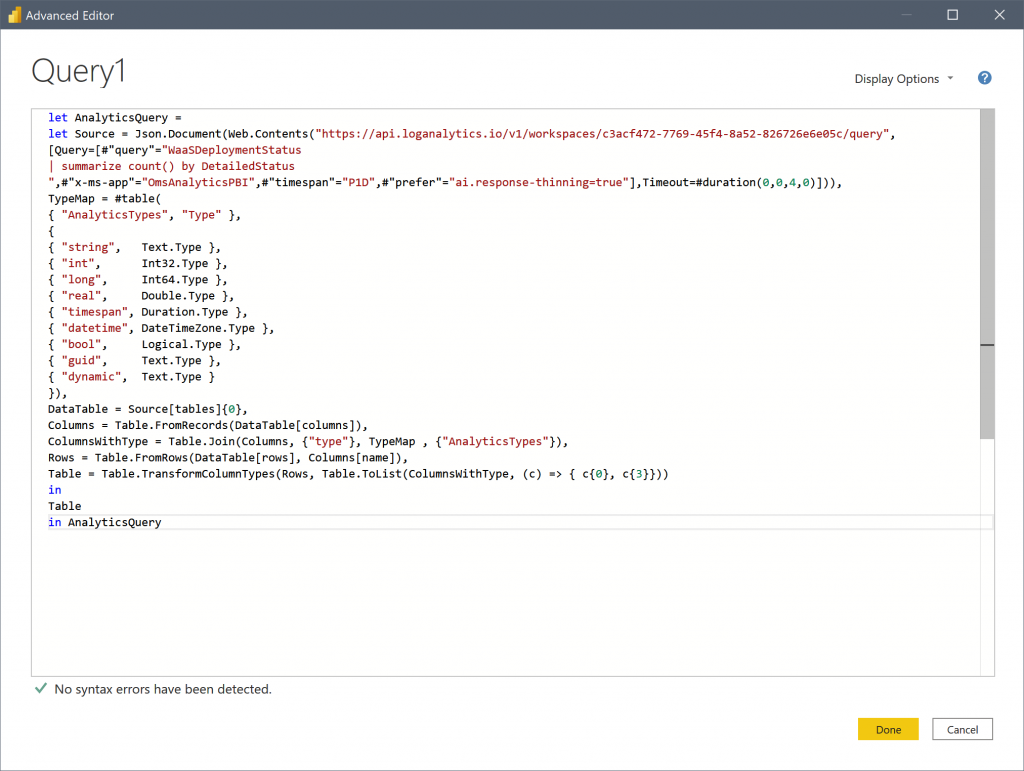
Then you’ll end up with this view and just click “Done” and “Close & Apply”. Now you’ll have the dataset in your report. When adding a second source like this, you might have to create the relationships between the tables. How easy/difficult that is, will of course vary. Use the link section to read up on how to solve that.
Go grab the guide from GitHub and have fun creating your reports!
Links
- GitHub custom reporting repository | https://github.com/phmehta94/IntuneAutomatedReporting
- Getting started with Kusto | https://docs.microsoft.com/en-us/azure/data-explorer/kusto/concepts/
- Power BI – Create a relationship manually | https://docs.microsoft.com/en-us/power-bi/transform-model/desktop-create-and-manage-relationships#create-a-relationship-manually